Live chat

x-analysis View

Speed up development projects on your IBM i applications


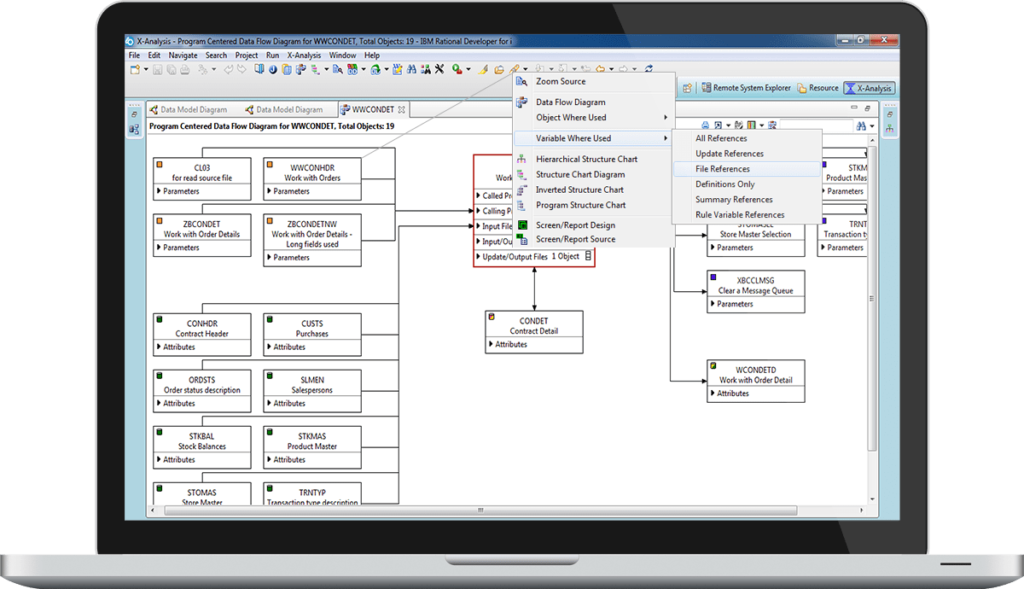
Comprehending your code, data model and the consequence of any changes to the system, can be difficult. By implementing X-Analysis View, you can automatically produce interactive graphical documentation, charts & graphs that deliver a 360-degree view into your IBM i applications. Obtain insight into your application and data and considerably decrease the time and effort needed to modify, maintain and test IBM i applications. With X-Analysis View, you’ll reach your business goals faster.

X-analysis view

With X-Analysis view you can achieve:

x-analysis view make code changes

Make code changes with confidence 
IBM i applications can be large and complex, so making changes can be a lengthy process that is prone to error. X-Analysis View gives you a deep understanding of the impact across all your applications, including any downstream consequences of changes you want to make. The result is better development, faster testing and greatly reduced risk.

X-analysis view moves projects forward faster

Move projects forward faster
Estimating IT projects is a challenge and can be a determining factor for whether they move forward. X-Analysis View improves effort estimation by providing in-depth detail about the cascading effects of change throughout your environment. X-Analysis View also shows you where to focus testing efforts by highlighting the objects impacted by a change.

Easily onboard new employees
X-Analysis View ramps up new developers quickly and allows them to contribute faster and work autonomously. Developers can quickly explore and navigate applications by seeing a graphical view at a high level with the ability to drill up or down, eliminating the need to ask other developers hundreds of questions.

X-Analysis View automatically  generates a data model diagram from the DDS, database objects and application code

Key Features in X-Analysis View

Interactive Graphical Documentation
Automated graphical documentation and data flow diagrams make it easy to visualize applications.
• Shows program control through call stack
• Provides object use, access, parameters, etc.
• Displays RPG as easy-to-read pseudo code

Where Used Functions
Powerful impact analysis tracks “where used” information throughout the application and database.
• Track variables through all iterations and associations
• Highlight every object affected by a change
• Document system functionality for audit, planning

Drill-Downs for Discovery
Powerful drill-down and drill-up capabilities ensure that you get precisely the level of detail you need.
• Provide detail right down to the source code
• Trace variables down through multiple layers
• Browse from anywhere to anywhere

Relational Data Models
Relational data model of your IBM i application databases provides a deeper understanding of your business.
• Automatically extracted from DDS, DB objects and source
• Provide a working model to support business and IT
• Show all related database files

To learn more about the benefits of using X-Analysis View , talk to an expert on +44 (0)1582 794 229 or email us. 

Redbourn Business Systems © 2022